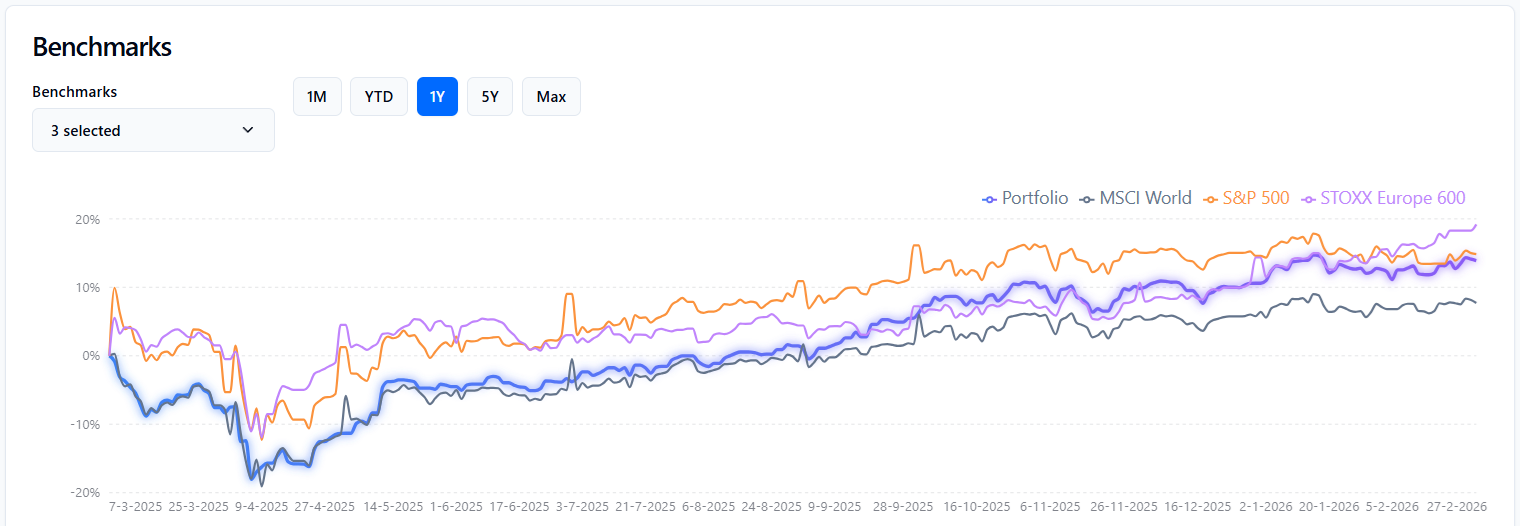
If you search for how to calculate ETF return, you usually find a clean yearly percentage on a fund factsheet or broker page. That number is useful—but it is not automatically your return. I built TrackinV because I kept seeing the same gap: a global ETF might show one figure, while my own account showed something else entirely. The difference is not a bug. It comes from cashflows, timing, fees, and cash drag. This guide explains how to separate fund performance from personal performance, when to use TWR, and how to benchmark fairly against funds like VWCE or WEBN.
Why ETF return and your portfolio return are not the same thing
An ETF’s published return reflects what happened to the fund itself: price change plus reinvested dividends, measured from one date to another. Fund managers and data providers typically report this as total return on the fund’s net asset value (NAV).
Your personal return adds a layer on top:
When you bought and sold. Two investors holding the same ETF can earn different percentages if they entered on different days.
How much you added or withdrew. A large deposit just before a rally inflates a simple account gain; a withdrawal before a drop can make your numbers look better than your investment choices deserve.
Broker fees and FX costs. Platform costs, transaction fees, and currency conversion on LSE-listed ETFs (common for European DIY investors) reduce what lands in your account.
Cash drag. Money sitting uninvested in your broker account earns little or nothing while the ETF moves. Your blended return sits below the fund’s return until that cash is deployed.
Tax withholding on dividends. US dividend withholding, for example, affects cash you actually receive even when the fund’s total return assumes reinvestment.
So when Dutch and Belgian DIY investors talk about etf rendement berekenen, they often mix two questions: “How did the fund do?” and “How did I do with my specific trades?” Those need different answers—and often different formulas.
Four ways to measure return—and when each one helps
Before you compare portfolio return vs benchmark, pick the metric that matches your question.
Simple return (holding-period return)
What it is: Total gain or loss divided by what you put in, often shown as a single percentage on your broker dashboard.
Good for: A quick snapshot of one position you bought once and never touched.
Limitation: Breaks down when you add money over time, hold cash, or run multiple accounts. A broker “+X%” figure can mislead because it may treat deposits as if they were always invested from day one.
CAGR (Compound Annual Growth Rate)
What it is: The steady annual rate that would grow your starting value to your ending value over a fixed period, ignoring intermediate cashflows.
Good for: Comparing long-run growth of a lump-sum investment or summarising a fund’s multi-year track record.
Limitation: CAGR assumes no deposits or withdrawals in between. If you dollar-cost average monthly, CAGR on your account balance alone does not describe your investment skill. For that scenario, use a dedicated tool like our CAGR calculator on a defined start/end pair—not on a balance that jumped because you transferred €500 every month.
TWR (Time-Weighted Return)
What it is: Return broken into sub-periods between each cashflow, then linked together. Each sub-period measures pure market performance; deposits and withdrawals do not distort the rate.
Good for: Answering “Did my allocation and fund choices beat the market?” This is the standard for portfolio return vs benchmark comparisons and for evaluating whether VWCE would have been a better strategy than what you actually held—holding your behaviour constant aside from stated trades.
Why DIY investors in NL/BE/EU need it: If you use DEGIRO, Trade Republic, and IBKR, each broker shows its own simple P/L. None knows your full picture. TWR on the combined portfolio is the fair basis for benchmarking.
Money-weighted return (Internal Rate of Return, IRR)
What it is: The return that makes your cashflows (deposits, withdrawals, ending value) reconcile. Large early deposits weigh heavily; timing of flows matters.
Good for: Answering “What return did my euro earn given when I actually transferred money?” Useful for personal wealth tracking, less useful for judging whether you picked good ETFs.
Rule of thumb: Use TWR to compare against VWCE or WEBN. Use money-weighted if you care about the experience of your cash timing—for example, whether waiting three months to invest idle cash cost you in absolute terms.
Worked example: monthly buys into a global ETF
Imagine you invest in a global equity ETF—call it “Global ETF”—with monthly €500 purchases through 2024. The fund itself has a strong year. Your broker still shows a modest green number. Here is why, in plain numbers without a spreadsheet grid.
Fund side (what the factsheet shows):
Global ETF starts the year at €100 per unit and ends at €112. With dividends reinvested in the fund, its total return for the calendar year might be roughly +13%. That is the figure you see when you calculate etf return from official fund data: start NAV to end NAV, including distributions.
Your side (what your account shows):
You did not own the ETF from 1 January. You bought €500 on the first trading day of each month. Some units were purchased near interim highs; later purchases benefited from a dip mid-year. By 31 December you hold units bought at an average cost above the January price, but you also did not have January’s full market move working on your full capital all year—because most of your money arrived later.
Your simple broker return might read around +8% on “invested capital.” That is not wrong for a quick glance, but it is not the same as the fund’s +13%. You had less exposure during the strongest early months and more during a flat stretch. Cash waiting in your settlement account for a few days each month adds a small drag. A €2 transaction fee twelve times is another slice off.
Now add one more layer. Suppose in June you also kept €2,000 in cash “for opportunities” instead of buying ETF units. The fund still returned +13% on fully invested capital. Your blended portfolio—ETF plus idle cash—might land near +6% to +7% on total account value, depending on exact dates.
The lesson: The broker headline “+X%” often mixes fund performance, your timing, fees, and cash. To ask “Would I have been better off in VWCE alone?” you need TWR on your actual trades, then compare that to the same-period TWR of the benchmark fund—not to its calendar-year factsheet return while you were still building the position.
How to benchmark fairly against VWCE or WEBN
Many European DIY portfolios use VWCE (Vanguard FTSE All-World, accumulating) or WEBN (Amundi MSCI World, accumulating) as a mental anchor: “Could I have done less work and matched the world index?”
A fair comparison requires aligned inputs:
1. Match the time window.
Compare from your first invested euro to today—or from a common start date both portfolios share. Do not compare your six-month account return to VWCE’s ten-year CAGR from a marketing page.
2. Use the same return type.
Your side: TWR from actual transactions across all brokers. Benchmark side: price return plus distributions for the ETF over identical dates, expressed as TWR. Mixing your money-weighted return with the fund’s total return is a common mistake.
3. Include dividends correctly.
Accumulating share classes (VWCE, WEBN) reinvest dividends inside the fund; total return indices capture that. If you hold distributing ETFs elsewhere, reinvested or paid dividends must enter your personal calculation or the comparison skews.
4. Adjust for cash separately.
Cash is not “underperformance” of your ETF—it is a different asset with ~0% return. Either exclude uninvested cash from the investment return calculation and report it as a line item, or include it knowingly when asking “How did my whole account do?” Those are two different questions.
5. Do not double-count overlapping exposure.
If you hold VWCE at DEGIRO and a world ETF at Trade Republic, benchmarking against VWCE still makes sense as a policy check—but recognise overlap. The benchmark answers “global equity market,” not “this one ticker only.”
6. Currency and listing.
VWCE trades in EUR on some venues and USD on others; your return is in account currency. Benchmark data should match the share class and currency you actually track, or you introduce noise from FX alone.
When you want this without rebuilding formulas each quarter, a structured portfolio benchmark workflow—first import trades, then pick VWCE or WEBN as the reference line—keeps the methodology consistent.
Checklist: data you need before you calculate
Whether you use a spreadsheet or an ETF portfolio tracker, gather:
Every buy and sell — date, units, price, fees, account/broker.
Dividends — amount, date, withholding tax if applicable, reinvested or paid out.
Deposits and withdrawals — bank transfers in and out of the broker; these define TWR sub-periods.
Cash balances over time — optional but important if you often hold idle cash; explains gaps vs fund return.
Corporate actions — splits, mergers (rare for broad ETFs but worth noting).
FX — if you buy USD-listed ETFs with EUR, record both trade currency and account currency where fees apply.
Missing one dividend or misdating a January buy is enough to make your personal line diverge from the benchmark by a full percentage point. Consistency beats precision to four decimal places on incomplete data.
Step-by-step: calculate ETF return and your portfolio return
Step 1 — Fund return (reference only).
Take start and end NAV for the ETF over your chosen window. Use the provider’s total return figure if available, or price change plus documented distributions. Label this “Global ETF fund return, period X–Y.” It describes the product, not you.
Step 2 — Sub-periods for your portfolio.
Split your timeline at every deposit, withdrawal, buy, or sell. For each sub-period, compute: (end value before cashflow − start value) ÷ start value.
Step 3 — Chain sub-periods (TWR).
Multiply (1 + r₁) × (1 + r₂) × … − 1. That is your time-weighted return for the window.
Step 4 — Benchmark TWR.
Run the same date logic on VWCE or WEBN prices (total return basis) over the identical window.
Step 5 — Interpret the gap.
Fund return higher than your TWR? Check timing of buys, fees, cash drag, and tax leakage. Your TWR higher than the benchmark? You may have had favourable timing or different exposure—not necessarily skill you can repeat.
Repeat when you add meaningful new data; see FAQ below for frequency.
FAQ
Is ETF performance the same as my return if I only hold that ETF?
Not necessarily—even with a single ETF and no other stocks. If you buy gradually, pay fees, or keep cash in the same account, your account’s simple return differs from the fund’s published total return. Only if you invested one lump sum at the start of the measurement period, reinvested all distributions the same way the index assumes, and paid negligible fees would the numbers closely align. For most DCA investors, they do not.
Should I use TWR or money-weighted return?
Use TWR when comparing portfolio return vs benchmark or judging fund selection and allocation—the question TrackinV is built around. Use money-weighted return when you want to know how your personal cash timing affected wealth, such as whether delaying investments hurt you in euro terms. Both are valid; they answer different questions.
How often should I calculate portfolio return?
For monitoring, quarterly is enough to spot drift without noise from daily volatility. Monthly suits active rebalancers or people still learning how cashflows affect numbers. Annually works if you hold a simple passive portfolio and mainly care about year-end reporting. Recalculate after any large deposit, withdrawal, or strategic change—not after every small buy unless you enjoy the exercise.
Can I compare my return to VWCE if I also hold cash?
Yes, but be explicit. Option A: Calculate TWR on invested assets only and compare to VWCE; report cash separately. Option B: Include cash in the portfolio return and accept that you will underperform VWCE by roughly your cash weight times the fund return—because cash earned less. Option A answers “How did my equity choices do?” Option B answers “How did my entire account do?”
What’s the fastest way to calculate this without Excel?
Export CSV files from DEGIRO, Trade Republic, or IBKR, then use software that imports transactions and computes TWR automatically. Manual Excel is fine for one fund and one year; it becomes error-prone with multiple brokers, currencies, and dividends. The fastest reliable path is import once, verify balances, then let the tool update when you add trades—see the CTA below.
Conclusion
Calculate etf return from fund data when you want to know how the product performed. Calculate your return with TWR when you want to know how your decisions, timing, fees, and cash behaved—and when you compare against VWCE, WEBN, or any other benchmark. Mixing those two figures is the main reason DIY investors think they “underperformed” an ETF they actually mimicked, or “outperformed” when luck and cash timing did the work.
TrackinV exists to close that gap for multi-broker portfolios in the Netherlands, Belgium, and wider Europe: import your trades, get time-weighted return, and plot a benchmark line without rebuilding spreadsheets every month.
Benchmark your portfolio against a global ETF in TrackinV (free TWR + benchmark).
This article is for informational purposes only and does not constitute financial advice. Always consider your personal financial situation, tax jurisdiction, and investment goals before making investment decisions. Past performance does not guarantee future results.